An article to understand EIS lithium battery applications, with typical circuit model diagrams
1. What is electrochemical impedance spectroscopy (EIS)? 🔍
1️⃣Electrochemical impedance spectroscopy (EIS) is a non-destructive parameter determination and effective method for determining battery kinetic behavior. A small-amplitude sinusoidal voltage signal with a frequency of w1 is applied to the battery system, and the system generates a sinusoidal current response with a frequency of w2. The change in the ratio of the excitation voltage to the response current is the impedance spectrum of the electrochemical system.
2️⃣By applying a small AC signal to the battery, its impedance response at different frequencies is measured and plotted as a Nyquist diagram (semicircle + oblique line).
3️⃣EIS is very practical and can be scanned from very low frequencies (several μHz) to very high frequencies (several MHz) to achieve a wide range of electrochemical interface reaction research. Foreign research has made breakthroughs in the establishment of EIS mathematical models and the practical application of EIS. The impedance spectrum of lithium-ion batteries generally consists of four parts, as shown in Figure 2
💡 Why use it?
1️⃣Non-destructive testing, without destroying the battery
2️⃣Precise positioning of problems: electrolyte failure? Electrode aging? SEI film thickening? One test will tell!
3️⃣Essential for scientific research & industry, optimization of consumer batteries, etc.
2. Equivalent circuit model: "disassemble" the battery into circuit components
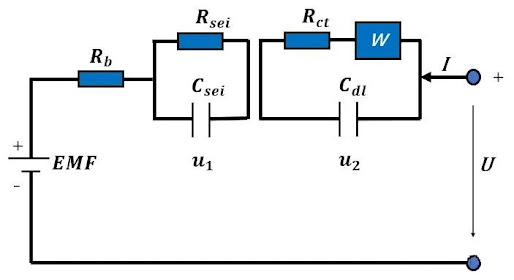
🔧 Core idea: Use components such as resistors, capacitors, and inductors to simulate the internal process of the battery! For example🌰: Typical lithium battery equivalent circuit model👇 RΩ (ohmic resistance) + Rct/Cdl (charge transfer resistance/double layer capacitance) + Zw (diffusion impedance)
🔋 Corresponding to the real battery structure:
1️⃣RΩ: Intrinsic resistance of electrolyte and electrode
2️⃣Rct/Cdl: Charge transfer at the electrode/electrolyte interface (such as the speed at which lithium ions are embedded in the electrode)
3️⃣Zw: Diffusion difficulty of lithium ions in electrode materials
📌 Key points: By fitting EIS data to the equivalent circuit, the "bottleneck" of each link can be quantitatively analyzed! (For example, Rct increases = battery fast charging capability decreases) The commonly used equivalent circuit model of lithium-ion batteries can be found in Figure 3.
III. How do temperature & SOC affect EIS results?
🌡️ Temperature effect: Under low temperature conditions, the electrolyte activity inside the battery is low and polarization is severe. At high temperatures, the high activity of the reactants makes the interface impedance and charge transfer impedance smaller, accompanied by the battery side reaction - interface decay.
1️⃣ Temperature↓ → Ion diffusion rate↓ → Rct and Zw soar!
2️⃣ High temperature may trigger side reactions (such as SEI film decomposition), resulting in long-term impedance deterioration.
3️⃣ Effect of SOC (state of charge): At low SOC: The concentration of lithium ions on the electrode surface is low, and the diffusion impedance (Zw) is more obvious → The Nyquist plot is steeper. At high SOC: The electrode material is close to saturation, and charge transfer (Rct) may become dominant.
🔬 Scientific research tips: Comparing EIS at different temperatures/SOCs can predict battery life and optimize BMS (battery management system)! ✨ Next issue preview: "EIS data fitting practice"
Canrd Brief Introduce
Canrd use high battery R&D technology(core members are from CATL) and strong Chinese supply chain to help many foreign companies with fast R&D. We provide lab materials,electrodes, custom dry cells, material evaluation, perfomance and test, coin/pouch/cylindrical cell equipment line, and other R&D services.
Email:janice@canrd.com
Phone/Wechat/WhatsApp/Skype:+86 18928276992
Website : www.canrud.com


No comments:
Post a Comment