

Figure 1: Voltage vs. specific capacity curves for nine cells during formation cycles, and conversion of these results to equivalent voltage (Veq) vs. lithium content (x). The figure shows the cell performance for different cell formulations and test conditions.


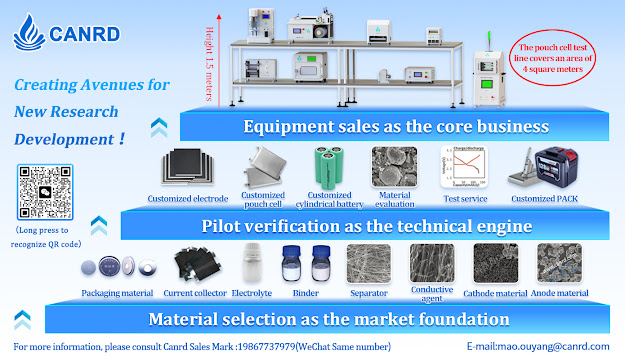
Canrd use high battery R&D technology(core members are from CATL) and strong Chinese supply chain to help many foreign companies with fast R&D.
Email:contact@canrd.com
Canrd Company Vedio/Website:www.canrud.com


No comments:
Post a Comment